Onchain Analysis: Bitcoin Network Usage
This article covers how onchain data can be used to assess Bitcoin network usage, and how this information can serve as a powerful leading indicator. Specifically, The Bitcoin Usage Momentum Indicator is explained.

This blog is part of an ongoing mini-series about onchain analysis.
Update 2023-05-10 - IMPORTANT
The Bitcoin Network Usage metric described here is based on the count of active addresses. With in introduction of BRC20 tokens and ordinals, the usage of the network has changed dramatically. The Bitcoin Network Usage metric therefore does not accurately reflect usage, at least not in a way to can be used to compare it to history. I no longer put weight on this metric in my analysis. Instead I have been looking into SOGA_Value_N, more on that coming soon.
What is usage of the bitcoin network?
The usage can be measured in various ways, such as total value transferred over the network per day, number of transaction per day and number of new addresses per day. Of course, these metrics reflect different aspects of usage.
Here, I define Bitcoin Network Usage as Number of Active Addresses per Day.
Active addresses per day convey information of mostly low value transaction, that is retail and smaller investors. Why? This blog post shows that most of the transactions involve young coins of low value.
By looking at the Number of Active Addressees we get a gauge on how engaged the typical bitcoin user is. In bullish periods, the Number of Active Addresses will increase as it is associated with new users and awakening of old users. Conversely, periods of flat or declining, prices tend to see lower Number of Active Addresses.
The Momentum of Bitcoin Active Addresses tells the story, before it happens
Lets dive into! Although looking at the raw Number of Active Addresses provides useful information, applying a Z-Score of 30/365 makes it much easier to visualize momentum changes. An article on why Z-Score is useful to create momentum indicators is coming soon.
I label the Active Bitcoin Addresses Z-Score 30/365 as the Bitcoin Usage Momentum indicator.
Lets look at Bitcoin Usage Momentum Indicator indicator since 2017.
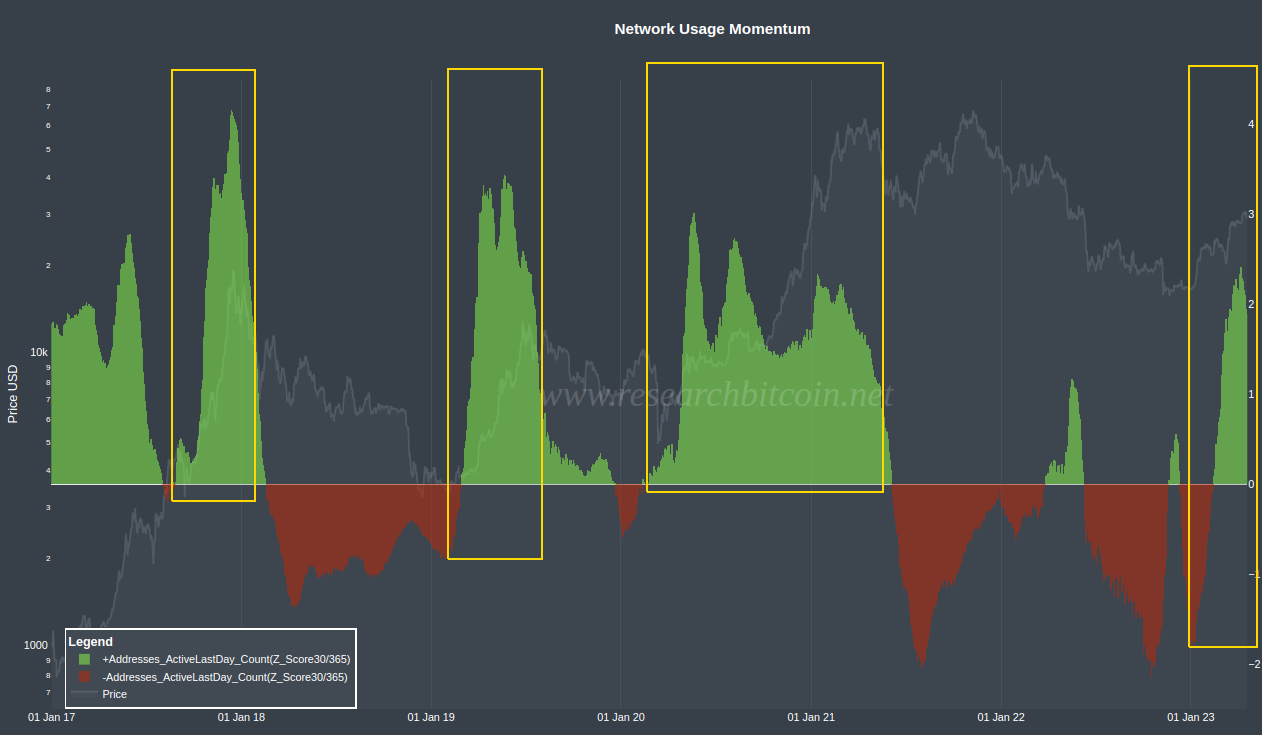
I have highlighted 4 yellow boxes show a major change in momentum. Note how the momentum rises dramatically. This is what you look for! When this happens, it is an early sign that this rally is not a fluke, but will sustain for some time. It shows that the increase in price is fundamentally supported by increased activity of retail and smaller investors.
On the flip side, the Network Usage Momentum tends to drop off in a equally dramatic fashion when the bull run is ending. This signals that the retail are exhausted and prices are about to drop, or at least remain stagnant.
Note that momentum can remain fairly high over extended periods, even if it's gradually losing steam. This occurred during the 2020/21 bull. As long as the momentum is high, prices can still increase, but the warning signs were clear that the fundamental support by retail and smaller investors was fading. The fact that Bitcoin reached a new high in this environment was surprising", but she surely had a snowballs chance in hell to go any further.
In conclusion,
A rapid increase in Bitcoin Network Momentum foreshadow sustained bullish price action, while a rapid decline is an early sign that a longer period of flat price action or retracement is coming.
You can find the Bitcoin Usage Momentum indicator on The Bitcoin Researcher's Onchain Analysis Suite (RBN) - link is on the front page of this website. It is free and open for all.